Original treatment threshold plots
The following four tabs show the treatment threshold plots as originally published1, for the full range from 0 to 336 hours of age.
In the Supplemental Information appendices, plots “zoomed in” to 0 to 72 hours of age are also provided.
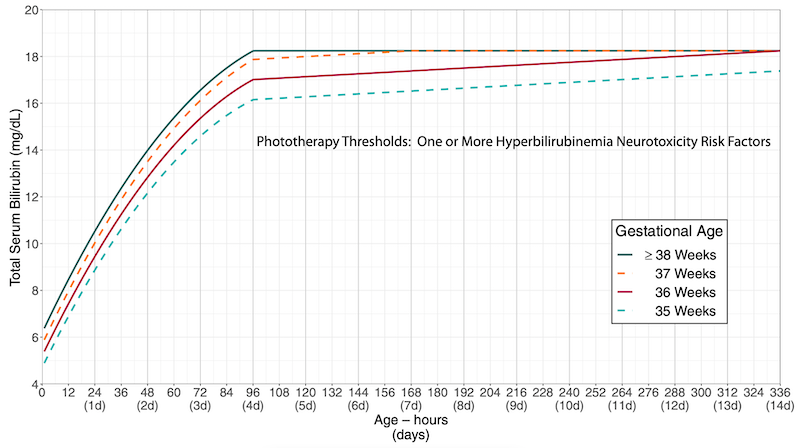
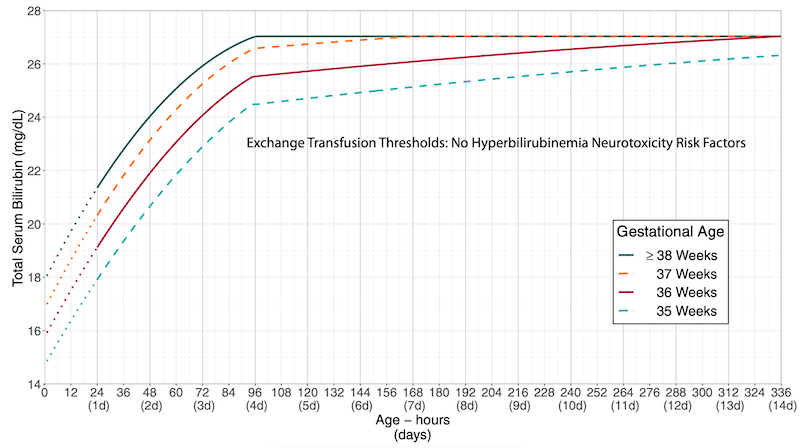
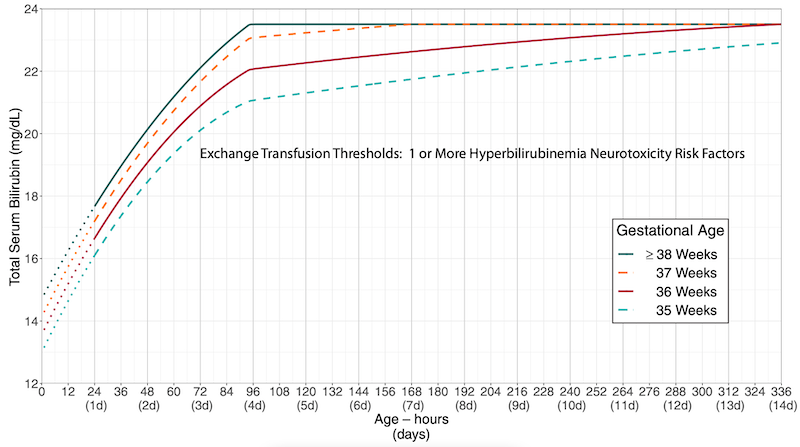
The four plots are grouped by the action under consideration (phototherapy versus exchange transfusion) and the absence or presence of neurotoxicity risk factors. Within each plot, separate curves for completed weeks of gestation at birth (from 35 through 40 weeks) contrast the difference in thresholds by gestation.
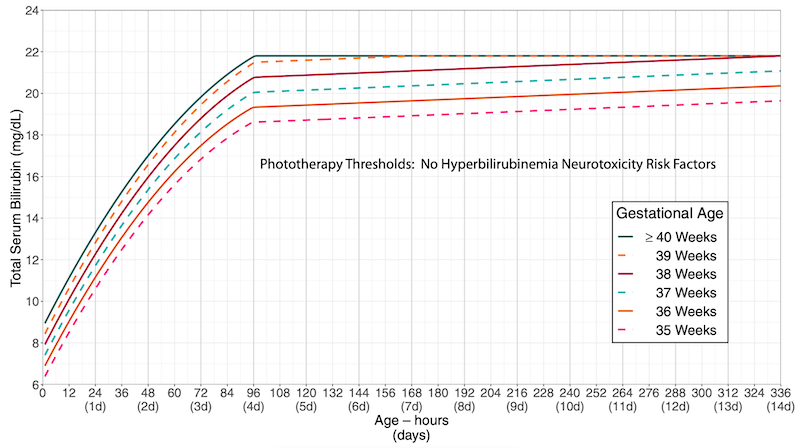
While this format was optimal to present the updates in treatment thresholds1,2, it was cumbersome for providing clinical care at the bedside.
For any given newborn, the provider would have to identify the correct plot (based on action and risk factor status) and then further identify the correct curve (for gestational age). Comparison between different plots was inconvenient (flipping between different charts, which were also on different scales).
Bilirubin threshold plot redesign
An alternative approach would be to generate plots that were newborn-centric instead of action-centric.
Each plot would be specific to a particular gestational age, obviating the need to identify the correct gestational age curve. Thresholds for multiple actions of interest could be simultaneously displayed; e.g., phototherapy, exchange transfusion, and region where escalation of care should be enacted.
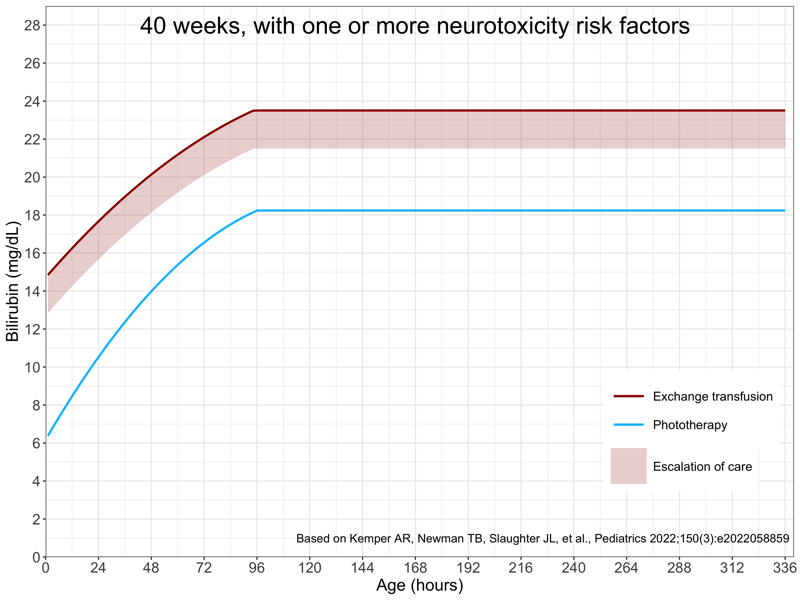
The following two tabs show the treatment threshold plots for a newborn of 40 weeks gestation, either with or without neurotoxicity risk factors.
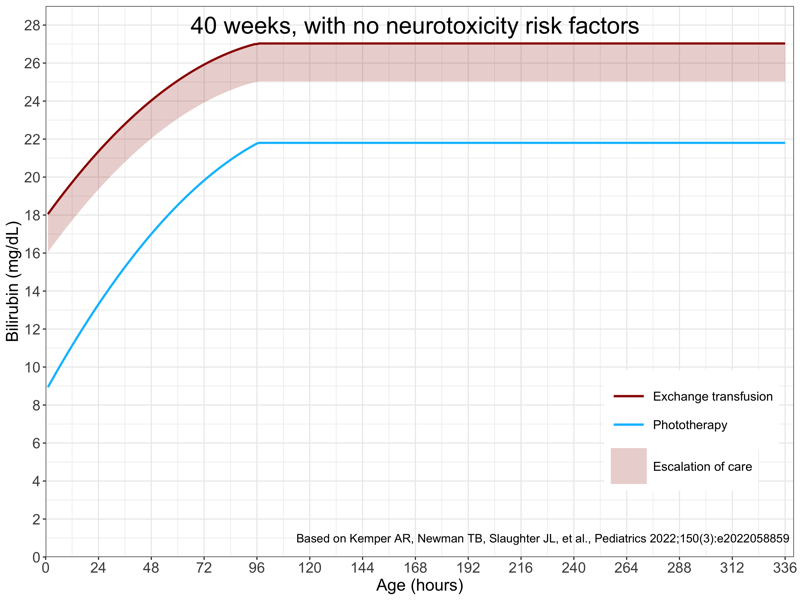
It would also be helpful to provide “zoomed in” plots. New treatment thresholds are provided up to 336 hours (14 days) of age, but most newborns will require assessment only during the birth hospitalization. My choice was to generated zoomed in plots for 0 to 96 hours (rather than the original supplemental materials 0 to 72 hours), as babies delivered by cesarean section are often admitted up to 4 days.
A minor challenge of this approach, and why it might be less practical to publish in this form, are the larger numbers of plots that are required:
6 gestational ages x 3 risk options x 2 zoom levels = 36 plots
However, generating the plots in computer code makes this quite easy.
It is important to note that the bilirubin threshold plot redesign is completely faithful to the thresholds in the official publication. The same curves are present as in the original publication, but simply separated into different groups for ease of use.
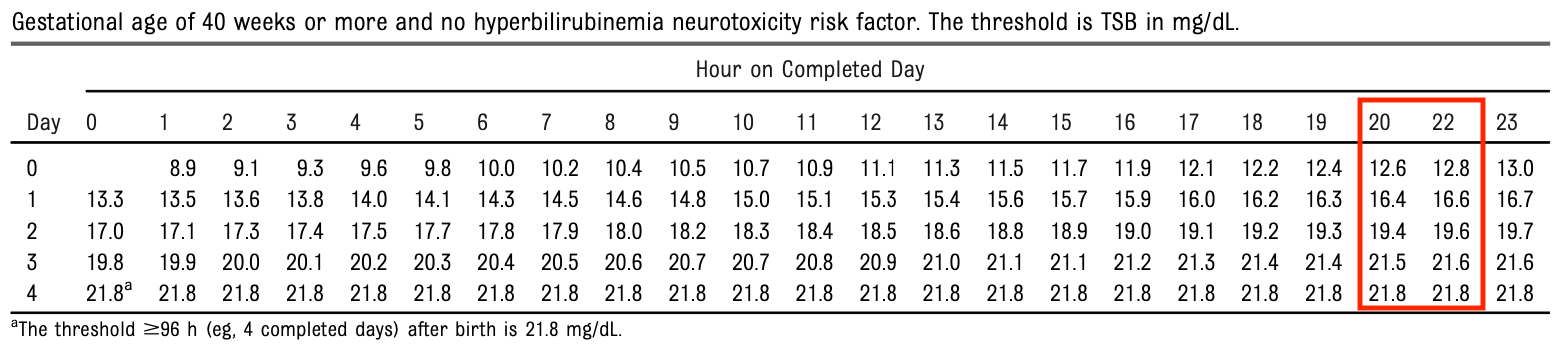
Many thanks to lead author Alex Kemper who pointed out to me that the tables in the supplemental materials in the original ePub early release had a small error in which one column of hours of age was missing for each day of life. Dr. Kemper provided corrected numbers and with more than one decimal place of precision, which made for smoother and more visually appealing plots (personal communication). This was subsequently corrected in the final publication PDF
Showing threshold plots both with and without neurotoxicity risk factors
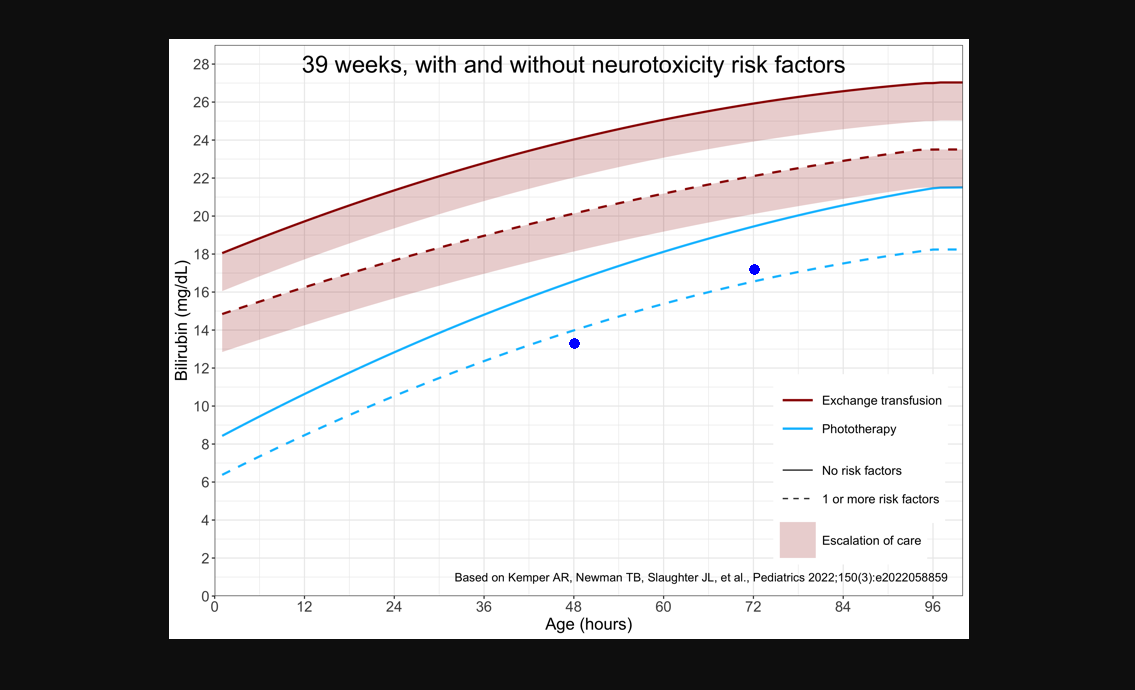
Another possibility would be the option to overlay the treatment thresholds both with and without neurotoxicity risk factors, for those situations where the correct classification is unclear.
A baby is born at 39 weeks gestational age to a blood type O positive / antibody negative mother. The baby’s blood type is B positive but direct antiglobulin test (DAT) negative.
At 48 hours, the total serum bilirubin is found to be 13.3 mg/dL and on follow-up at 72 hours, has increased to 17.2 mg/dL. The baby’s hematocrit is found to be 36% with a reticulocyte count of 6.8%.
Although a positive DAT might more convincingly support isoimmune hemolysis, in this scenario there is sufficient clinical suspicion for hemolysis that visualizing the trend in bilirubin measurements on a plot that showed thresholds both with and without neurotoxicity risk factors might be helpful.
PediTools clinical decision support tool
The above discussion provides some justification for the design goals of the PediTools clinical decision support tool for the AAP 2022 hyperbilirinemia management guidelines, which was originally deployed on August 8, 2022, with additional features added over time.
Features
- Determination of specific treatment threshold numbers by gestational age at birth
- Presentation of results with neurotoxicity risk factors absent, present, or both
- Plotting on both the original publication and easier to use custom threshold plots
- Both the full 0-336 hours and zoomed-in plots
- Plot multiple measurement time points to visualize trends
- Post-discharge follow-up decision support, determined by difference between phototherapy threshold and the most recent measurement
- Calculate rate of increase between last two measurements
- Flags when a transcutaneous bilirubin should be confirmed with a total serum bilirubin
- Convenience calculator for age in hours from dates and times of birth and measurement
Additional features may be added, if beneficial for providing optimal clinical care.