… per chance discoveries which may warrant further investigation…
Generalized solver for the minigames, using light information theory and Bayesian approach.
‘For once you have tasted flight, you will forever walk the earth with your eyes turned skyward, for there you have been, and there you will always long to return.’ -…
Dexamethasone has been used to facilitate extubation in preterm infants, but higher-dose courses are associated with neurodevelopmental disability. This is a comparison of…
Optimizing Pocket Frogs gift farming with the Anura search minigame.
R code to use growth chart tables of percentile values to recreate LMS parameterization – with perfect data, only 3 values needed per set of parameters.
Quality assurance testing of Fenton 2025 LMS parameter calculations to generate an electronic growth chart
Comparison of Fenton, Olsen, and WHO growth charts and observations on the interpretation of small, large, preterm, and term.
Predictive modeling of performance characteristics, including takeoff, climb, cruise, and landing. FOR EDUCATIONAL PURPOSES ONLY.
Delay textInput processing until submit button or enter key is pressed, with example Shiny app to fetch METAR data.
Quick test of executing a Julia code block from within a Quarto blog post.
Using {leaflet} with a GeoTIFF background layer and resolving difficulties with RGB colormaps
Updated to an interactive shinylive client-side web application to analyze historical METAR weather data for flight conditions by month and time of day.
Newborn gestational age calculations in R. Given any set of LMP, EDC, DOB, date, GA, age, DOL, PMA, calculate as many of the others as possible.
Creating an Alfred app workflow to trigger the PediTools 2022 AAP hyperbilirubinemia guidelines webtool via zsh script
Helper functions for vectorized parsing of gestational age strings to numeric and back
Preparing PediTools for the future: support for 120+ distinct growth curves and beyond, including bulk calculations, plotting, and custom growth chart generation.
WHO Growth Standard expanded chart parameters – mildly automated data scraping and metadata parsing.
How to spend hours down the rabbit hole of finding precise definitions for night flying and analyzing exactly how accurate the usual rule of thumb is.
Creating customized, precisely-sized, double-sided, laminated, easy-to-update checklists.
Creating a navigation log with heading, time, fuel consumption, and weight & balance calculations, also suitable for printing and folding for use on a kneeboard.
Retrieving long lost instructions on how to fold aviation charts, both the original Duncan McKillop method as well as a later improvement by Steve Hirlehey
Update the original poor quality 30 kb GIF of aviation wind and temperature aloft forecast locations with R-generated vector graphics
Generate Magic Labyrinth random game boards and analyze fairness for different player start locations.
Given a vector of values, create a ggplot histogram with overlaid best-fitting normal curve, with prettified caption of numerics
Developed an R Shiny app to facilitate conversions of flight plans to Google Earth video tours.
Using R to convert a .FPL flight plan into a Google Earth video tour
Create a ggplot geom_bar plot with bars ordered by value, x axis labels rotated, and y axis formatted as percent
Analyzing historical METAR weather data for flight conditions by month and time of day, including calculation of crosswinds for available runways.
Linear interpolation of missing dependent values based on an independent variable, not permitting extrapolation
After decades of dreaming of flying, I scheduled and experienced a ‘discovery flight’.
Extrapolation of the original CDC 2000 BMI-for age growth charts beyond the 97th percentile is a really, really bad idea – graphical demonstration.
Convert a delimited text column of substrings in a dataframe into multiple columns specifying presence or absence of that substring
Hyperbilirubinemia management recommendations for infants at less than 35 weeks gestation, based on Stanford Premie BiliRecs
Code snippets to deterministically anonymize identifiers and dates, while maintaining intra-individual time series relationships, to facilitate sharing examples of clinical…
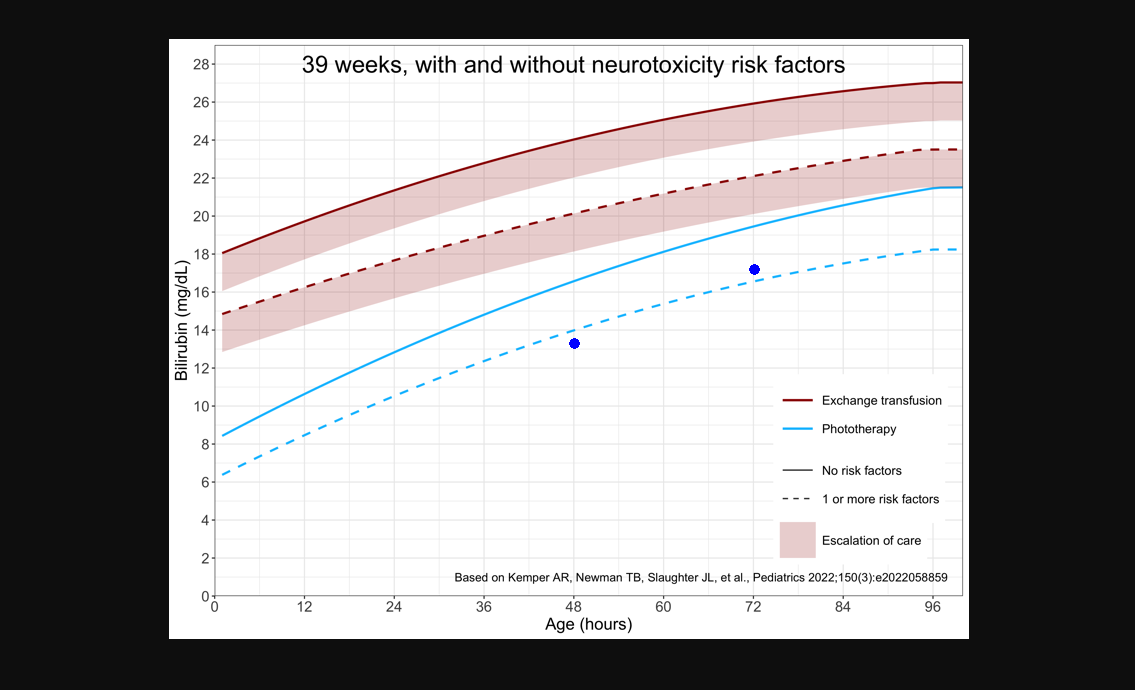
PediTools clinical decision support tool for managing neonatal hyperbilirubinemia, including newly developed treatment threshold plots to facilitate clinical care.
Comparing bilirubin phototherapy and exchange transfusion thresholds between the AAP 2004 and 2022 guidelines
R
blogdown
Advent of Code is a great way to learn a new programming language.
Animal Crossing New Horizons uses Mendelian inheritance of bi-allelic polygenic traits to determine flower colors. I wrote some tools in R to help plan flower crosses.
Find a Minecraft stronghold in just three Eye of Ender throws
medianeffect
How to cheat at anagram word puzzles (or Scrabble) with Python.
Playing RISK recently, I was annoyed when I lost a battle despite overwhelming numbers. ‘What are the odds of that?!?’ Which led me to write this simulation.
Natural language processing of wine descriptions to predict wine review scores.
Using Pokemon spawns and geocoding to identify biomes.
This function takes a set of overlapping intervals and returns the union of the intervals.
This blog will serve as a place to share data science analyses, professional and personal projects, snippets of useful code, and other various geekery.