Background
In 2000, the CDC released age- and sex-specific growth charts for children from age 2 to 20 years for weight, height, and body mass index (BMI), including LMS parameters to calculate percentiles and Z-scores (Flegal and Cole, 2013).
However, the degree of severe obesity in children now frequently extends beyond the original selected percentiles between the 3rd and 97th, and extrapolation beyond the 97th percentile is not recommended. Alternative methods fo monitor with extremely high BMI were proposed (Hales et al., 2022; Wei et al., 2020).

Based on this work, on December 15, 2022 the CDC released extended BMI-for-age growth charts for very high BMI, extending to a BMI of 60. Several recent publications refer to the use of the extended BMI charts (Barlow and Hampl, 2023; Hampl et al., 2023; Ogden et al., 2023).
My PediTools website(Chou et al., 2020) has had calculators supporting the CDC 2000 growth charts for some time. Calculating percentiles and Z-scores beyond the 95th percentile BMI requires alternative methods from standard LMS calculations, but these methods were added in August 16, 2023, presenting the 2022 CDC extended BMI-for-age calculations when they exceeded the 95th percentile.
At first, I hesitated to remove the previous “standard” calculations for BMI over the 95th percentile, with the reasoning that they might be needed for “legacy” reasons.
However, I got curious about what the original 2000 growth charts might look like, if used much beyond the 95th percentile. That exploration follows.
The bottom line outcome: for BMI over the 95th percentile, I plan to remove all calculations using the original CDC 2000 charts, unless the user specifically requests them. Extrapolating using the original 2000 LMS parameters results in terrible artefacts and should not be relied upon.
Creating custom growth charts
A number of years ago, I developed an R Shiny app to allow bulk calculation of percentiles and Z scores for any growth chart with available LMS coefficient data for (currently 14 different chart families, each with up to 3 different anthropometric measures).
A side function of this app was the ability to generate customized growth charts, with user-selected percentile curves.
CDC 2000 BMI, up to 97%ile
Here’s a side-by-side comparison of the output from the CDC web site versus the R Shiny App of the 2020 BMI-for-age for boys growth charts.
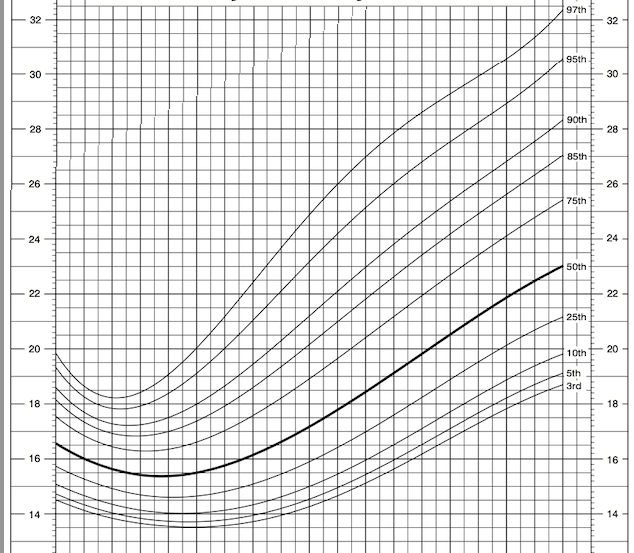
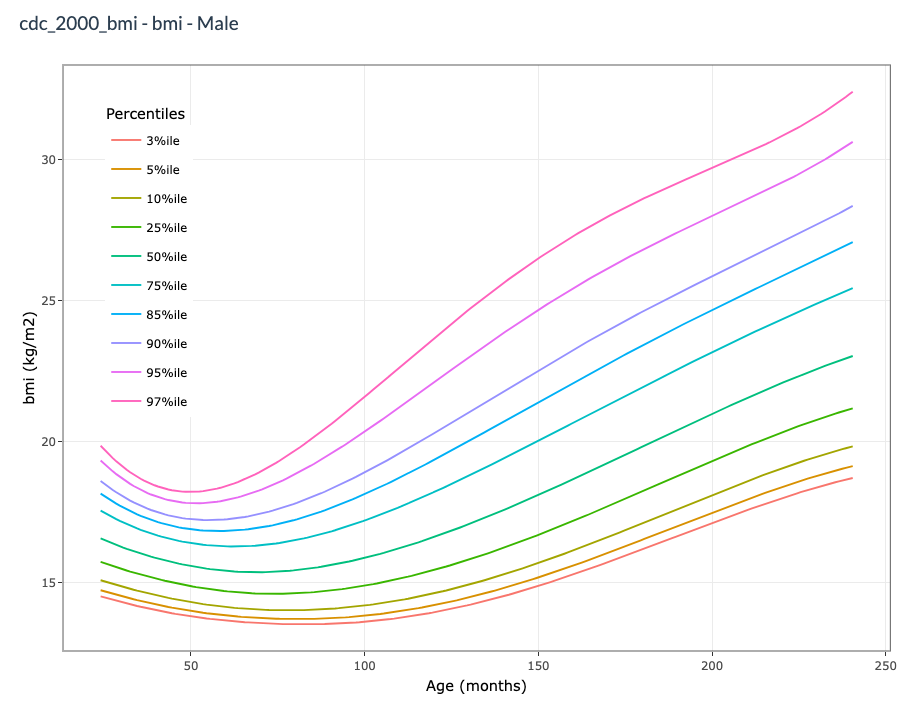
I selected the identical percentile lines (3, 5, 10, 25, 50, 75, 85, 90, 95, 97), and they appear pretty “well-behaved.”
CDC 2000 BMI, problems beyond the 97%ile
But what happens if we try to extend beyond the 97%ile? As we extrapolate further, the curves get progressively more problematic… Here, we add the 99%ile (which seems unusually widely spaced away from the 97%ile), and then the 99.8%ile (which generates a large hump), and finally the 99.9%ile (which shoots completely off the top of the plot).
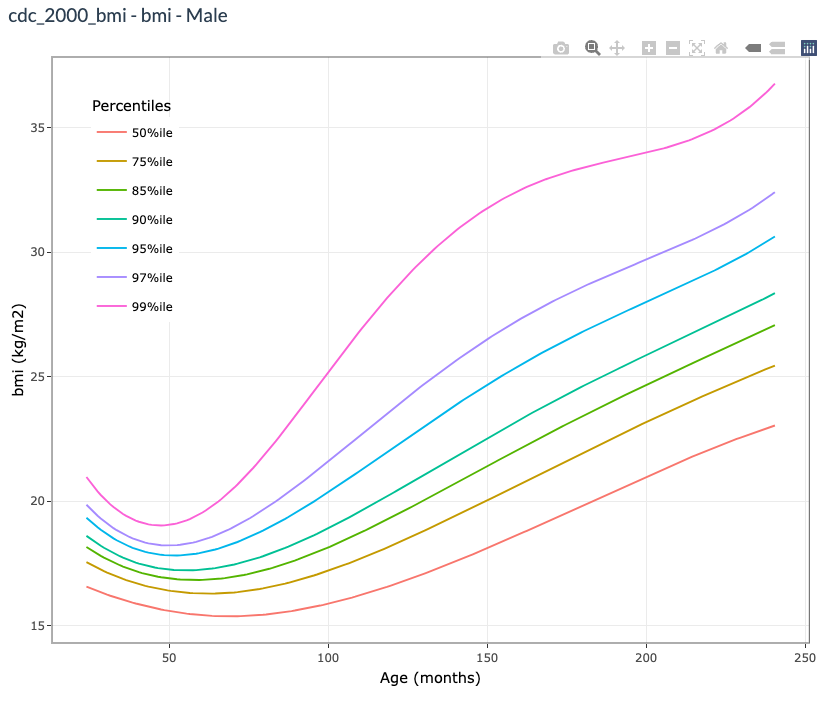
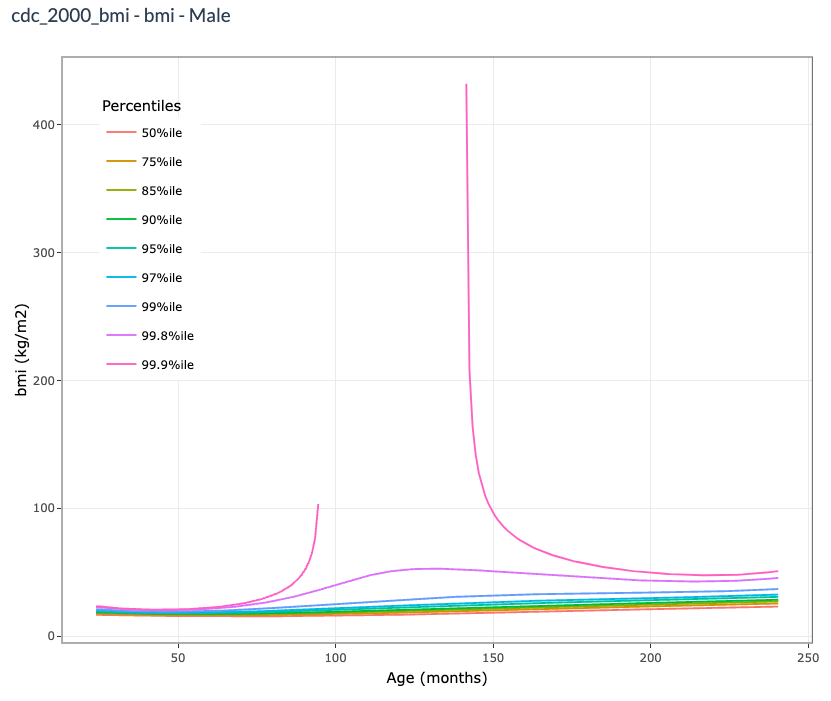
I think it’s quite clear that using the LMS parameters provided for just the CDC 2000 BMI-for-age charts is not a great idea, with strange things already starting to become evident at the 99%ile, which really isn’t that extreme.
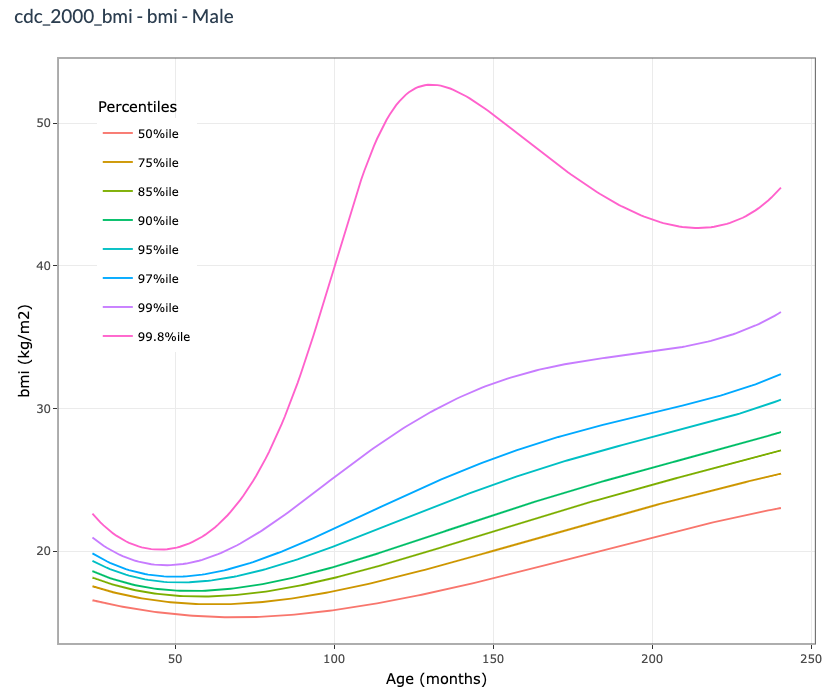
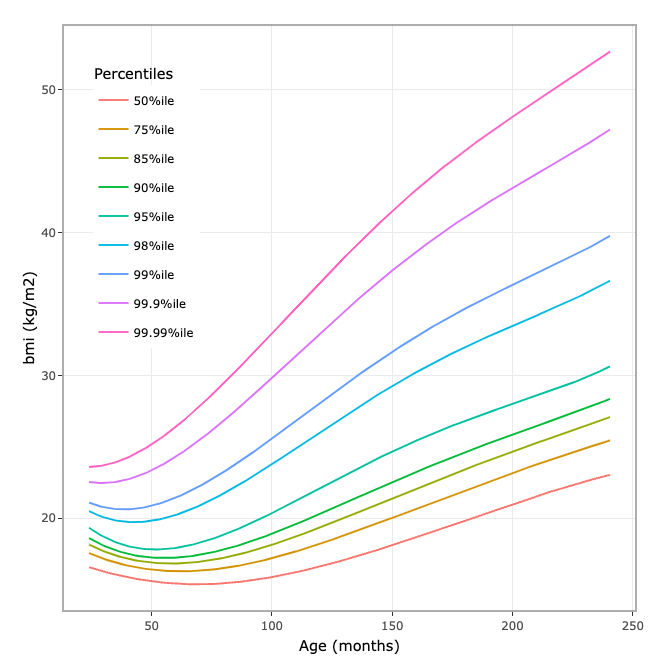
CDC 2022 extended-BMI-for age
Using the CDC 2022 extended-BMI-for age calculations smooths out the BMI curves out to the 99.99%ile. The R shiny app-generated plot matches the CDC released chart (I left out the percentiles lower than 50%ile).
Conclusion
It’s a really bad idea to use the original CDC 2000 BMI-for-age parameters to calculate percentiles and Z-scores past the 97%ile. I’ll be updating the PediTools calculator to only use the 2022 CDC extended BMI-for-age calculations above the 95%ile.
References
Footnotes
From https://free-images.com/display/scale_diet_fat_health.html (CC0).↩︎